The 2022 Star Ratings represent a measurement year that will be an outlier. Star Ratings were the highest they have ever been, yet churn is the largest health plans have experienced. CMS made a variety of decisions to help avert the COVID impact, including:
- Delaying implementation of the guardrails for one year (enabling cutpoint changes by more than 5% if national performance declined)
- Expanding the hold harmless provision for improvement measures to prevent an overall rating decrease
- Temporarily removing the 3x weighted HOS measures due to the undermining effects from COVID
The HOS removal and Member Experience weight changes have been fundamental in shifting the average Star Rating. As described in our article published August 11, 2021, before the 2022 changes, Member Experience measures accounted for 37% of Star Ratings. The removal of the above measures boosted the importance, with Member Experience measures now accounting for 43% of all measures. In 2023, with the Star Rating removals, temporary suspensions, and proposed additions, Member Experience measures will account for 60% of the ratings.
Key Observations
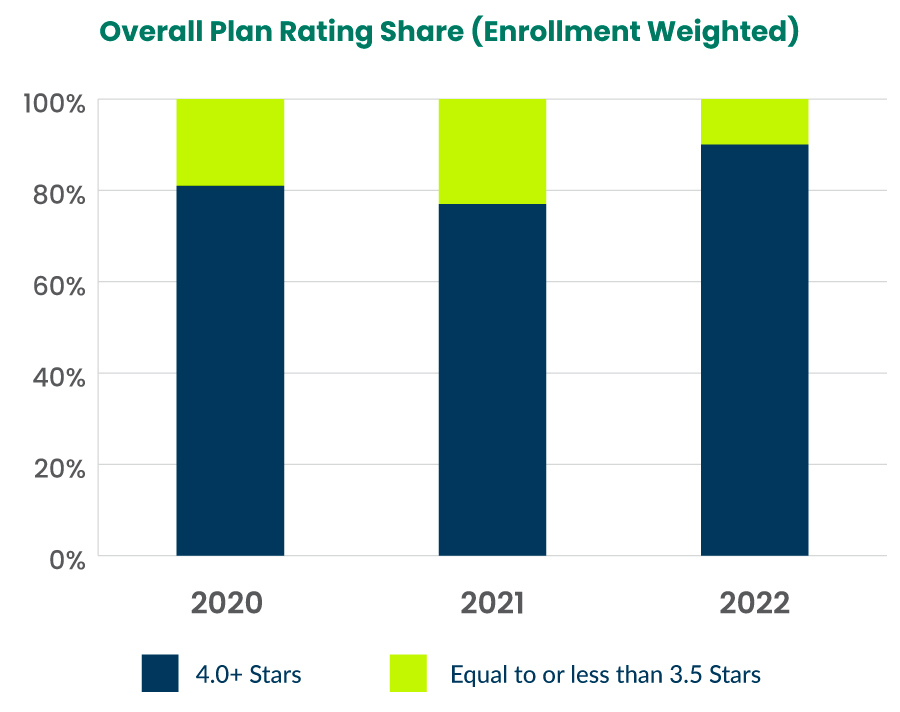
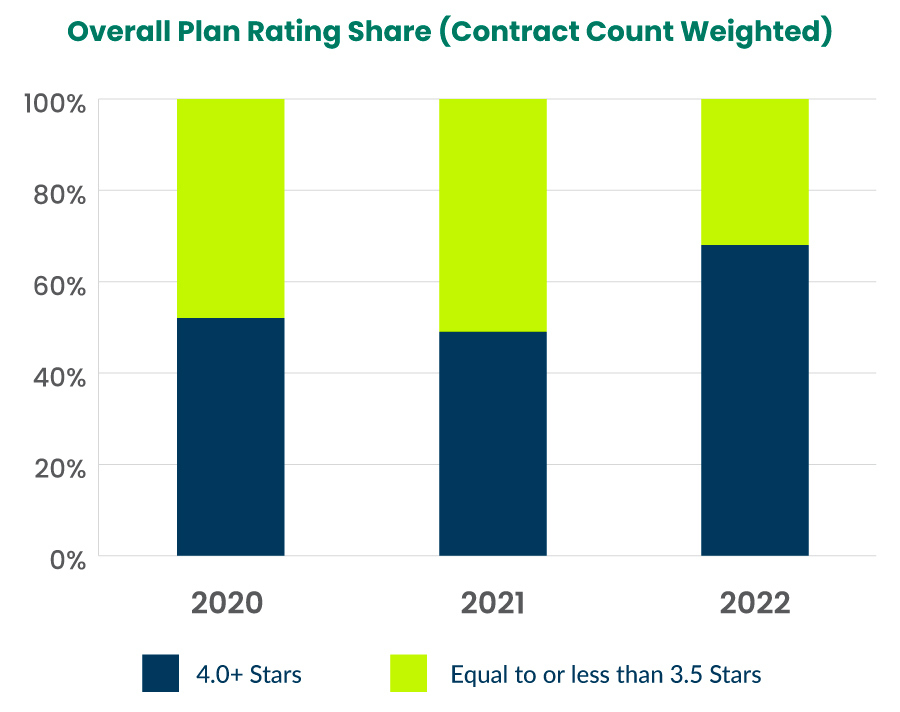
Both the share of 4.0+ rated plans by enrollment and count increased from 2021. Ninety percent of membership is enrolled in a 4.0+ rated plan, representing 68% of contracts by count. This is an unprecedented increase over the 77% of members who belonged to a 4.0 Star plan last year.
Graphic Description
This bar chart displays the overall plan rating from the years 2020-2022 with enrollment weighted. 2022 had the highest count of health plans with 4 Stars or more and fewer with 3.5 or less compared to the previous years.
In addition, 26.6% of members are enrolled in a 2022 5-Star plan, which is a 2.9x increase from 2021 ratings (9.15% of members were enrolled in 5-Star Plans in the 2021 ratings). This is key because these plans are allowed to market year round compared to others that are permitted to do so only during the open enrollment period (October 15 to December 7). This relates specifically to United, Humana, Kaiser, and Centene, which have outsized market share and all achieved a 5-Star Rating in 2022.
Over time, this could create an uncompetitive market for smaller regional plans already losing 65-70% of all new MA members to the largest health plans. For this reason, it’s more important than ever for these regional plans to drive toward a 5-Star Rating to remain competitive.
Sixty-eight percent of plans received 4 Stars or higher and are eligible for a 5% Quality Bonus Payment (QBP) on top of their benchmark. QBPs accounted for over $11.6B in Medicare expenditures in 2021.
Graphic Description
This bar chart displays the overall plan rating share for 2020-2022 with contract count weighted. While 2021 had fewer plans with 4 stars or more, 2022 had the most at 68%.
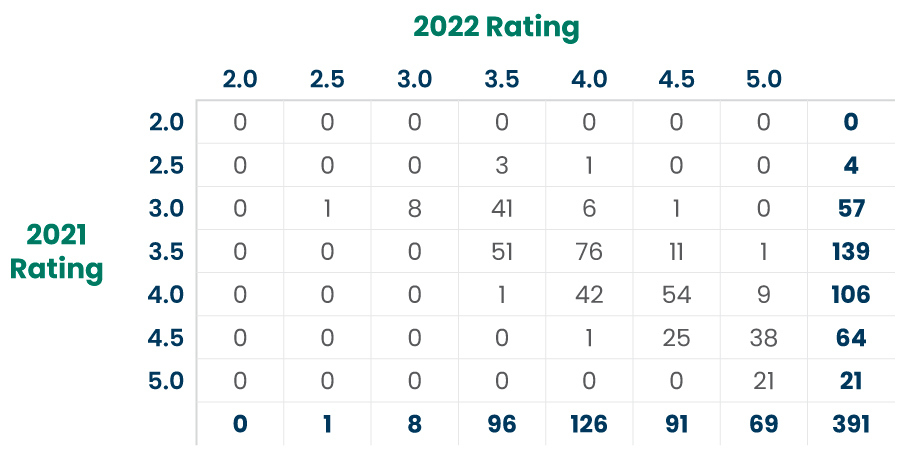
391 contracts received a Star Rating in both 2022 and 2021. The movements in ratings from 2021 to 2022 are summarized below:
Graphic Description
This table shows the rating movements from 2021-2022. Notice the increase in ratings of 4 Stars or over in 2022.
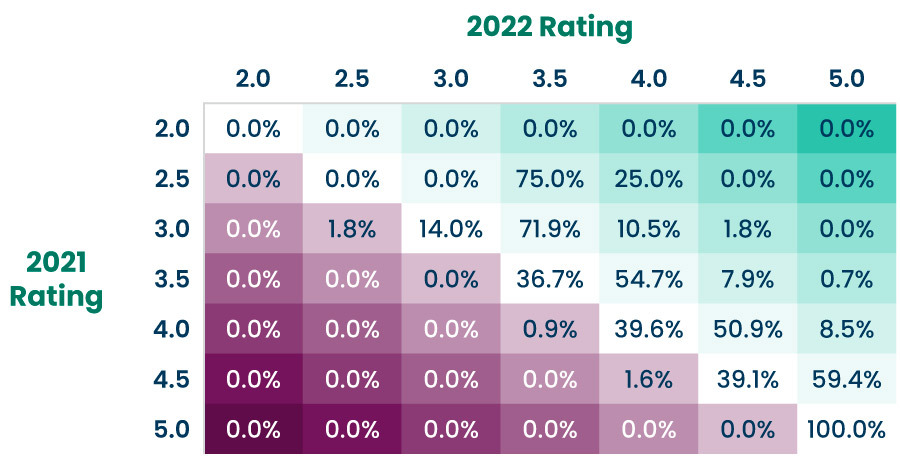
In addition to the above, the following presents the percent of plans performing in 2021 against 2022. For example, 1.8% of 2021 3-Star plans fell back to a 2.5-Star Rating in 2022, 39.1% of 4.5-Star plans maintained a 4.5-Star Rating in 2022, and 54.7% of 2021 3.5-Star plans improved to a 4-Star Rating in 2022. The largest change was 2.5-Star plans moving to 3 Stars.
Graphic Description
This table displays the percentage of plans performing in 2021 against 2022. The largest change was 2.5-Star plans moving to 3 Stars.
Overall Star changes from 2021 to 2022 for the 391 plans with ratings in both years are summarized below.
More than one-third (37.65%) of plan contracts maintained the same Star Rating year over year. It’s less common to move by more than 0.5 in either direction (8.2% of contracts). Compared to 2021, plans were much more likely to improve or maintain their Star Rating in 2021.
- Improved: 61.6% of plans vs. 16.4% of plans in 2021 (+45.2%)
- Maintained: 37.6% of plans vs. 62.0% of plans in 2021 (-24.4%)
- Fell back: 0.8% of plans vs. 21.5% of plans in 2021 (-20.7%)
2022 Disaster Adjustments
The extreme and uncontrollable circumstances policy for the 2022 Star Ratings noted that if a measure-level Star Rating was lower in the current year, the measure-level Star Rating would revert to the rating from the prior year. The following are contracts in the 2022 Star Ratings that reverted to the 2021 Star Ratings for eligible measures.
MA
+ 3.9 times
SNP
+ 9 contacts 0.6 times
MA-PD
+ 1.4 times
PDP
+ 2.8 times
CAHPS and Member Experience
The Patients’ Experience and Member Complaints (“Member Experience”) consideration was a critical influencer for the 2022 Star Ratings and will only continue to be so going forward with the weight change from 2 to 4. The CAHPS performance is based on the higher of the 2021 or 2022 Star Rating for each CAHPS measure given. (Note: Plans were allowed to rely on their 2020 Star Rating for the 2021 year due to COVID, so those that rely on 2021 ratings may be defaulting back to the 2020 Star Ratings).
Member Experience with Plan (CAHPS) Measures
The following are measures captured through the CAHPS survey:
| Getting Needed Care | Patients’ Experience and Complaints Measure | CAHPS | 1.5 | 2 | 4 |
| Getting Appointments and Care Quickly | Patients’ Experience and Complaints Measure | CAHPS | 1.5 | 2 | 4 |
| Customer Service | Patients’ Experience and Complaints Measure | CAHPS | 1.5 | 2 | 4 |
| Rating of Healthcare Quality | Patients’ Experience and Complaints Measure | CAHPS | 1.5 | 2 | 4 |
| Rating of Health Plan | Patients’ Experience and Complaints Measure | CAHPS | 1.5 | 2 | 4 |
| Care Coordination | Patients’ Experience and Complaints Measure | CAHPS | 1.5 | 2 | 4 |
| Rating of Drug Plan | Patients’ Experience and Complaints Measure | CAHPS | 1.5 | 2 | 4 |
| Getting Needed Prescription Drugs | Patients’ Experience and Complaints Measure | CAHPS | 1.5 | 2 | 4 |
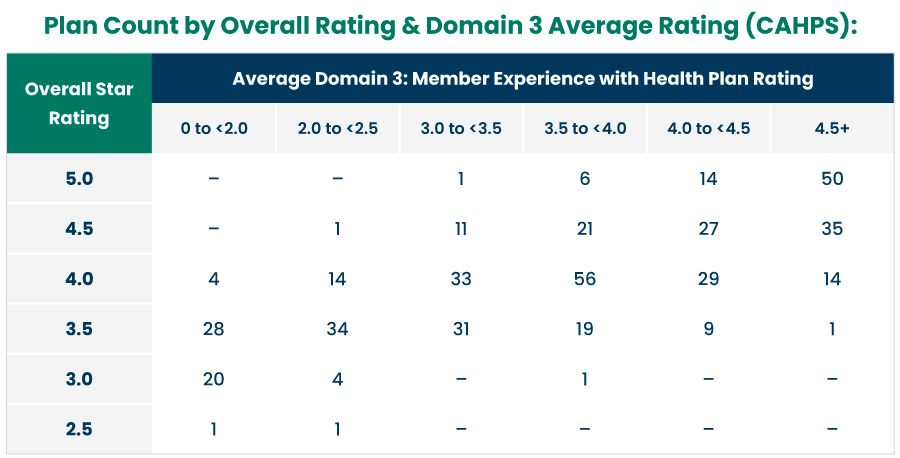
CAHPS measures in the category “Patients Experience and Complaints” have a 2.0 measure weight for 2022 and make up approximately 20.6% of an overall MA-PD Score (approximately 19.7% for MA-PD SNP). Performance in these measures is highly influential in the overall rating of a contract:
Graphic Description
This graph displays plan count by overall rating and Domain 3 Average rating (CAHPS).
- 94.4% of plans achieving an Overall Rating of 4.0 Stars or higher achieved at least a 4.0 average rating in Domain 3.
- 89.4% of plans achieving an Overall Rating of 4.0 Stars or higher achieved at least a 3.5 average rating in Domain 3.
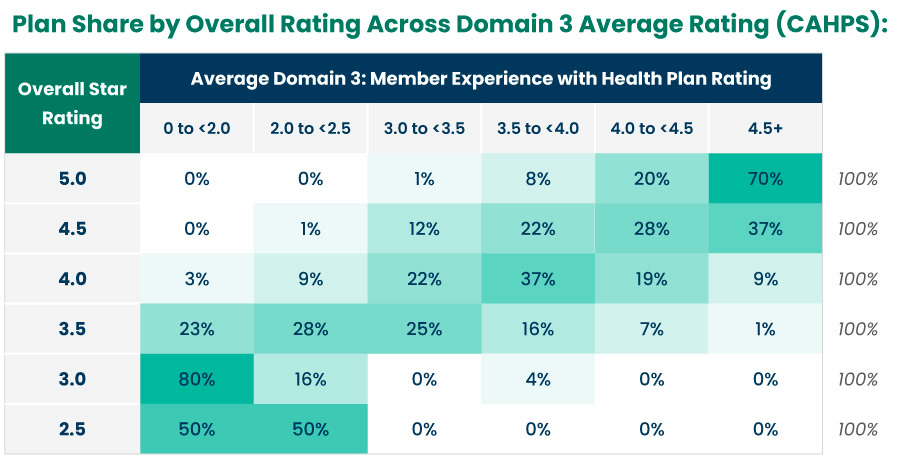
Graphic Description
Graph Description: This table displays the increase in plan share by overall rating across Domain 3 Average rating (CAHPS).
In addition to the CAHPS measures, others also contribute to the overall Member Experience rating:
| Complaints about the Health Plan | Patients’ Experience and Complaints Measure | CTM | 1.5 | 2 | 4 |
| Members Choosing to Leave Plan | Patients’ Experience and Complaints Measure | MBDSS | 2 | 2 | 4 |
| Plan Makes Timely Decisions about Appeals | Measures Capturing Access | IRE | 2 | 2 | 4 |
| Reviewing Appeals Decisions | Measures Capturing Access | IRE | 2 | 2 | 4 |
| Call Center – Foreign Language Interpreter and TTY Availability | Measures Capturing Access | Call Center | 2 | 2 | 4 |
| Complaints about the Drug Plan | Patients’ Experience and Complaints Measure | CTM | 1.5 | 2 | 4 |
| Members Choosing to Leave the Plan | Patients’ Experience and Complaints Measure | MBDSS | 1.5 | 2 | 4 |
For the 2022 Star Ratings, 94.8% of plans achieving an Overall Rating of 4.0 Stars or higher achieved at least a 4.0 average rating in Patients’ Experience and Complaints Measures. 87.8% of plans achieving an Overall Rating of 4.0 Stars or higher achieved at least a 3.5 average rating in Patients’ Experience and Complaints Measures.
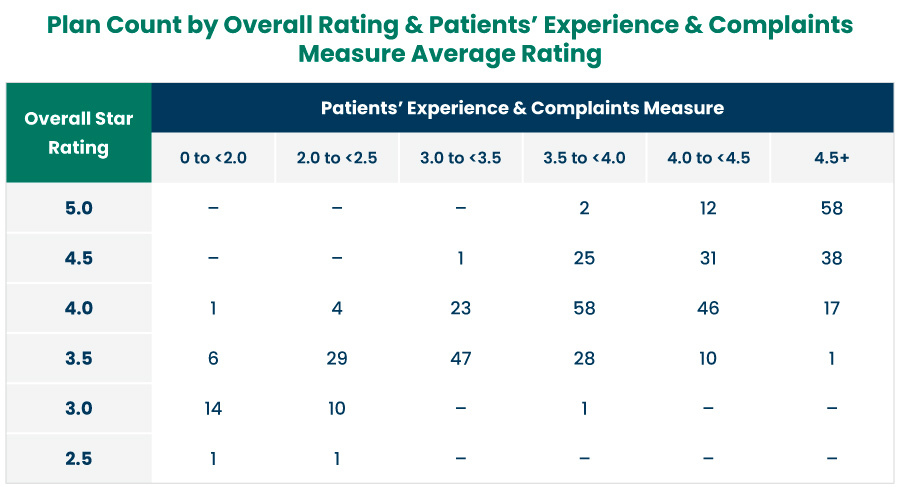
Graphic Description
This table displays the plan count of Overall Rating along with the Patients’ Experience and Complaints Measure.
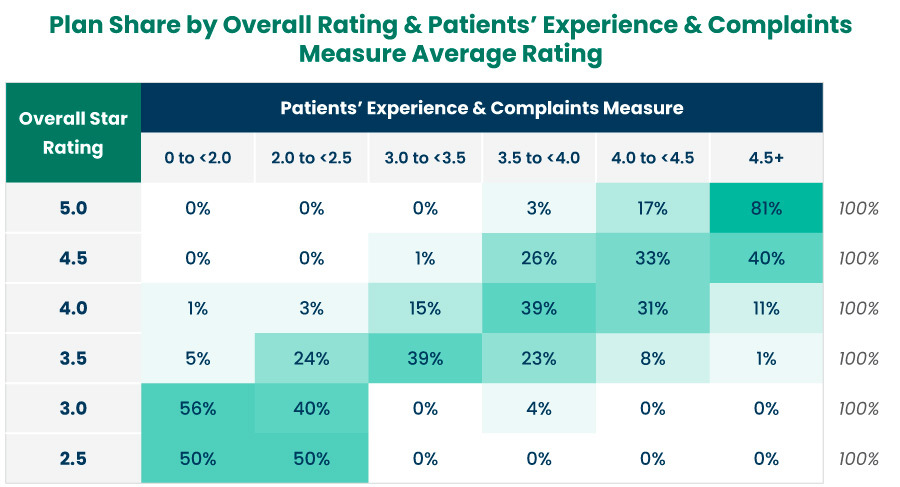
Graphic Description
This table shows the overall plan share by percentages in the Patients’ Experience and Complaints Measure.
A previous Icario article analyzed the impact of the overall weight changes. For 2022, we analyzed all Member Experience Star Ratings (in addition to CAHPS), to understand the impact of moving from 1.5 to 2 Stars. We found that changing the weighting from 1.5 to 2.0 changes the overall rating from 3.58 to 3.63.
2022 MA Stars Ratings: Voluntary Churn
For 2022, voluntary churn increased from 2021 (up 0.3% for the average). This reflects an 8-year high for voluntary churn across MA.

Graphic Description
This table displays the percentages of health plans members choosing to leave from the years 2015-2022. 2022 has the highest member churn rate at 13.4%
It’s not surprising that plans with lower Star Ratings showed a much higher churn rate. For example, in 2022, plans with 2.5 Stars saw a 17.3% average churn rate; plans with 5 Stars experienced only a 4.1% churn rate.
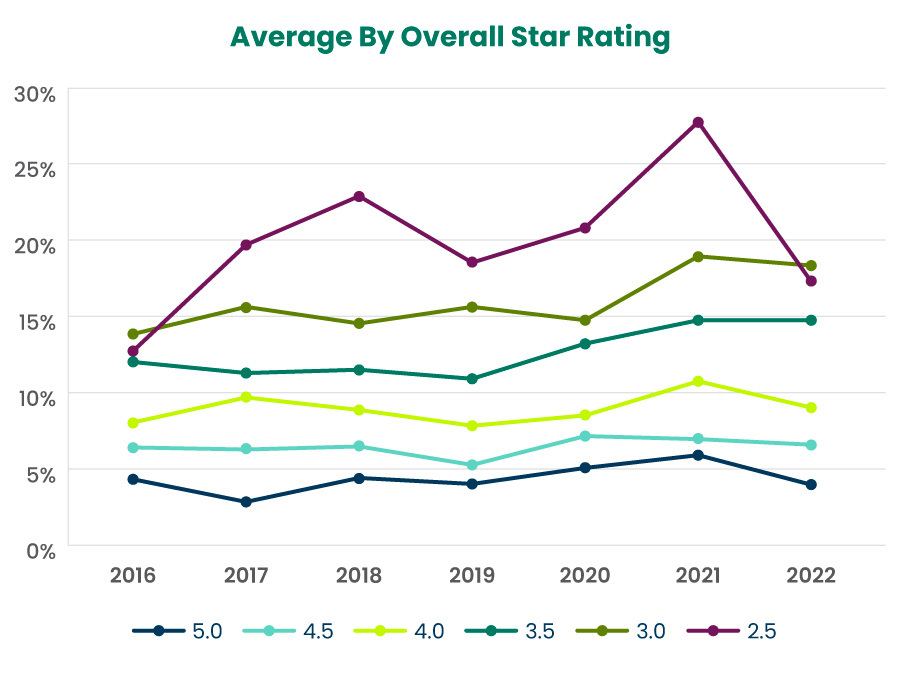
Graphic Description
This graph displays the average churn rate by overall Star Rating. Most notably, plans with a 2.5 Star Rating experienced a churn rate of 17.3% compared to 4.1% for 5 Star plans.
In looking at the category “Members Choosing to Leave Plan,” the churn rate among the upper 75th percentile of contracts is 19%, meaning 25% of plans have a churn rate of 19% or higher. However, plans in the upper 25th percentile churned at a rate of only 6.0%.
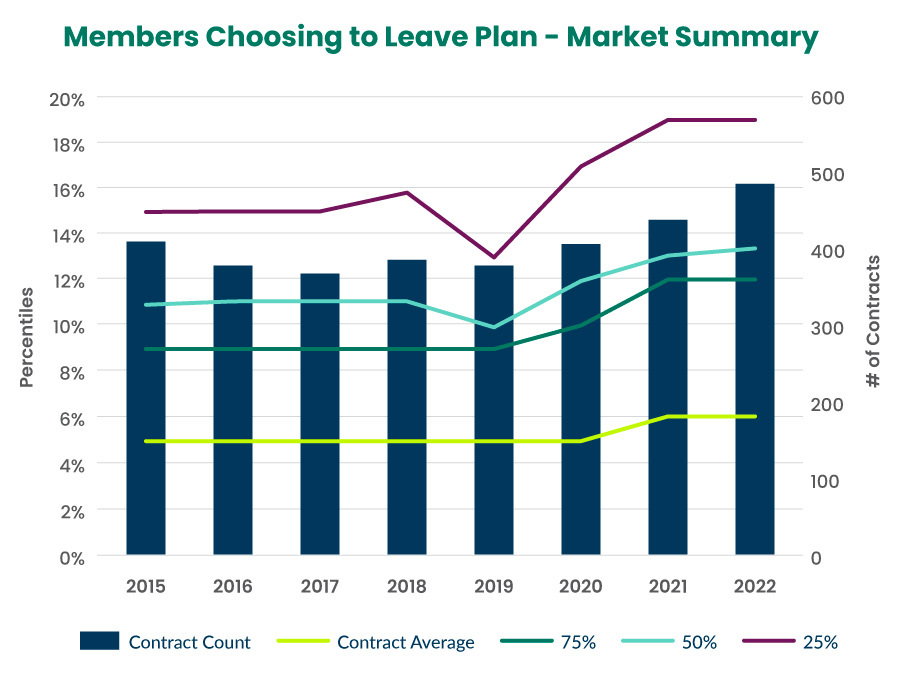
Graphic Description
This graph shows the member churn rates throughout different percentiles in the market. 25% of plans have a churn rate of 19% or higher.
Recap of Significant Changes to Star Ratings
There have been significant changes to the 2022 Star Ratings. There are additional changes anticipated for 2023 reflected below.
2022 Changes
| |
|
2023 Anticipated Changes
| |
|
|
|
|
|
Implications for 2022 Star Ratings
This is a historical high for the number of people enrolled in plans with 4-Stars. With the ability to leverage 2020 ratings established by the Public Health Emergency where the plan would otherwise experience poorer performance – the ratings have been overinflated in such a way that we should expect to see a significant drop in performance with regression toward the mean in 2023. Plans will need to continue to invest heavily to keep their ratings high now that a larger number may experience a fall from grace.
In addition, with churn rates also being at an all-time high, plans cannot afford to underinvest in Member Experience. To understand the magnitude of the impact, a plan that has 200,000 members with a capitation payment of $840 per member per month and a 13% churn rate will lose $262M in reimbursement. Reducing plan churn by 5% (to a churn rate of 8%) will increase revenue by $100M.
Likewise, when plans receive a higher rating, they have a corresponding increase in their QBP. A greater portion of QBP can go toward supplemental benefits to create a more comprehensive package as well as a competitive advantage, especially as more plans are easily able to offer $0 premium options. These $0 premium plans combined with a robust set of supplemental benefits create the most robust offering likely to attract additional membership.
Aetna, Cigna, Humana, and United already announced updates to their benefit plans with additional supplemental benefits for their populations, many of which address social determinants of health (SDoH).
The $6 billion that CMS is spending on QBPs will force a reckoning that will result in lower ratings. This path of improvement is unsustainable, and a drop is inevitable. This will largely impact those teetering on a lower rating where a change will force a downward rating correction and a substantial decrease in revenues year over year.
Worth noting is CMS’ anticipated reinclusion of the Tukey outlier deletion for the 2022 measurement year. Through this mechanism, the highest and lowest rate plans are removed to calculate cutpoints. The impact of this change will prevent outliers from having an outsized effect on Star Ratings, but increasing cut points will also change the distribution of plans receiving 4 Stars and above.
It will also cause poorer-performing plans to continue to experience a decline in ratings as more outliers tend to fall at the low end of the distribution, creating a downward shift for overall Star Ratings. Some report the Tukey outlier deletion will bring balance to the estimated increase in Star Ratings created by the Member Experience Star Rating weights. The goal of the Tukey outlier methodology is to ultimately save CMS millions of dollars in QBPs by decreasing the propensity for awarding higher Star Ratings.
This year’s Star Ratings represent a systematic shift with seismic effects on future Star Rating years. At this point, 2022 is the last year plans will have a grace period afforded by COVID. This combined with the levers that will create a downward adjustment foretell a decrease in Star Ratings, and plans will need to work quickly to address future impacts.
Improving Member Experience ratings can help offset the Tukey outlier effect and other mechanisms designed to save money through decreased QBPs. Member Experience will be one of the most critical drivers of Star Ratings. In this environment, there is no such thing as over investment to drive Member Experience scores higher to help maximize these Star Ratings.


